
What Percentage of Breakouts Fail? Data From 1,611 Signals
75.5% of 1,611 tracked breakouts failed — two-thirds fully reversed. The rates by session, timeframe and pair, and why the sample still paid +337R.
Ask the internet how often breakouts fail and you'll get confident percentages with no dataset in sight. Seventy percent. Eighty. "Most." Numbers that circulate through trading forums the way ghost stories circulate at campfires — repeated forever, sourced never.
We're in a position to count. Every signal our engine fires is tracked from entry to exit and published weekly, winners and losers. So we pulled every completed breakout-family signal in our database — 1,611 of them, February 24 to August 7, 2026, across 15 instruments — and did the arithmetic.
75.5% failed. The sample still made +337R.
Both halves of that sentence are the article.
The number, precisely
Every signal in the sample is a breakout entry — breakout continuation or Asian range breakout — with a defined entry, stop, and target at fire time. (If your entries come from chart patterns instead — an ascending triangle's ceiling, a cup and handle's rim — the event is identical: a break of a level the market had been pressing against. These base rates are your base rates too.) This is the shape most of the failures die as:
Three things can happen after a signal fires:
| Outcome | Signals | Share |
|---|---|---|
| Hit the target | 395 | 24.5% |
| Reversed to the stop | 1,075 | 66.7% |
| Expired at the 72-hour evaluation deadline | 141 | 8.8% |
So the citable numbers, defined strictly:
- 75.5% of breakouts failed to follow through to their measured objective.
- 66.7% — two in three — reversed all the way through the entry to the stop.
Two honesty notes, because a stat is only worth citing if you know what's inside it. First, we count strictly: 79 signals expired in profit but never tagged the target — they're in the failure column anyway. Second, these were filtered breaks. Every signal here had already cleared momentum and level-quality checks before it fired. The naked level pokes that never made it past the filters — the ones most traders chase manually — fail more often than this.
Why a 75% failure rate still paid +337R
Here's the table the failure-rate ghost stories never include:
| Metric | Value |
|---|---|
| Win rate (realized R above zero) | 29.4% |
| Average loser | −0.97R |
| Average winner | +3.04R |
| Breakeven win rate at those numbers | ~24% |
| Expectancy per signal | +0.21R |
| Net result, 1,611 signals | +337R |
The average loser costs just under one unit of risk — that's the stop doing its job. The average winner pays back three. At that ratio you break even winning 24% of the time, and the sample won 29.4%. That five-point gap, compounded across 1,611 signals, is +337R.
This is the entire economics of breakout trading in one paragraph: the failure rate is the price of admission, and expectancy is the product. You don't get the +3R runners without paying the −1R tolls on the way. Anyone selling you a way to skip the tolls is selling you the ghost story.
And it puts a number on a mistake we see constantly: taking profit at +1R "to be safe." At a 29.4% win rate, capping winners at one unit of risk turns +0.21R per signal into roughly −0.39R — the same signals, the same failure rate, now a losing system. The 75% failure rate makes letting winners run mandatory, not stylistic.
Failed breakouts die fast — and that's useful
| Outcome | Median time to exit |
|---|---|
| Stopped out | 1.8 hours |
| Hit target | 6.0 hours |
| Expired | 72 hours (the deadline) |
The market grades a breakout almost immediately. Half of all failures were dead within two hours; winners took three times longer to mature. A break that's going to work starts working — a break that loiters around the entry, going nowhere, is usually telling you which column it's headed for.
Practically: the fast failure is a feature. Each loser costs −1R and gets you an answer in under two hours. That's cheap information — as long as the stop is where the system put it, not where it stopped hurting.
The session paradox
Bucketing the 1,611 signals by the session they fired in (same windows as our best-time-to-trade study):
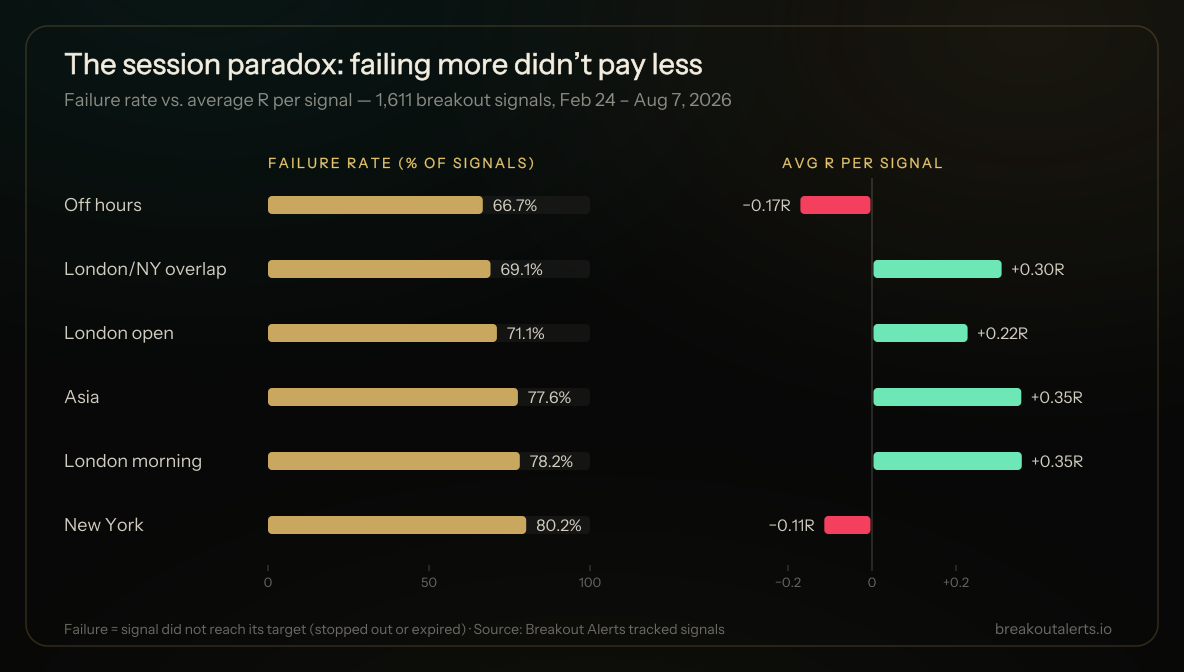
| Session | Signals | Failure rate | Avg R / signal |
|---|---|---|---|
| Off hours | 63 | 66.7% | −0.17 |
| London/NY overlap | 298 | 69.1% | +0.31 |
| London open | 197 | 71.1% | +0.22 |
| Asia | 379 | 77.6% | +0.35 |
| London morning | 330 | 78.2% | +0.35 |
| New York | 344 | 80.2% | −0.11 |
Read that twice, because it dismantles the obvious strategy of "trade the sessions where breakouts fail least."
The lowest failure rate on the board — off hours at 66.7% — lost money. The two most profitable windows, Asia and the London morning, failed at nearly the highest rates in the sample. And New York managed the only clean sweep: the most failures and a negative average.
Failure rate doesn't rank sessions. Expectancy does. When an Asian-hours or London-morning break holds, it travels far enough to pay for a crowd of failures; when a US-afternoon break holds, it usually doesn't go anywhere worth the wait.
The table above is a fixed sample, frozen when this piece was written. The same split across our whole book — every strategy, updated continuously — is published on the breakout statistics page, with sample sizes and methodology attached.
Timeframes: same failure rate, very different paychecks
| Timeframe | Signals | Failure rate | Avg R / signal |
|---|---|---|---|
| M15 | 906 | 74.9% | −0.01 |
| H1 | 417 | 77.5% | +0.63 |
| H4 | 246 | 69.9% | +0.31 |
(Daily and above: only 42 completed signals, nearly all deadline expiries — too few to say anything honest, so we won't.)
The failure terrain is roughly flat — call it 70–78% everywhere. The economics aren't: H1 breakouts paid +0.63R per signal, the best single cut in this entire dataset, while M15 churned near breakeven despite the biggest sample. Faster charts don't fail much more often; they just pay less when they work — one more reason timeframe selection matters more than most traders think.
By instrument: silver is the fakeout king
A few standouts from the per-instrument cut (minimum 30 signals):
- JPY crosses held best. EUR/JPY had the lowest failure rate in the book — 68.0% — and paid +0.63R per signal, with GBP/JPY and USD/JPY right behind. If you want breakouts that stick, the yen board was the place.
- Silver was the fakeout king: 91.1% of XAG/USD breakouts failed. Fewer than one in eleven reached target. Cite that the next time someone calls a silver break "clean."
- The Dow proved the whole thesis in one row. US30 failed 76.9% of the time — worse than average — and still averaged +0.95R per signal, the highest payout of any instrument. Its rare winners were enormous.
- Cable and crude leaned trap-heavy: GBP/USD failed 80.8%, WTI 80.6%.
Same engine, same rules — the levels behave differently by market. Worth knowing before you treat every chart the same.
Longs, shorts, and one honest regime note
Long breakouts failed 74.1% of the time and averaged +0.30R. Shorts failed 80.6% and averaged −0.15R. In this stretch of 2026, breaking down was a meaningfully worse trade than breaking up.
We'd resist tattooing that one anywhere: it's five-plus months of a broadly risk-on tape, not a law of markets. But it's a live reminder that "the setup" and "the tape it fires into" are separate inputs — and only one of them is printed on the chart.
Is 75% just one bad month? No.
Monthly failure rates across the sample: 71.7% (March), 71.1% (April), 82.3% (May), 73.3% (June), 84.0% (July). In no full month did even three in ten breakouts follow through.
This isn't a drawdown statistic. It's the terrain breakout traders walk on, every month, in every regime we've tracked. Systems that survive it are built for it — which is exactly why win-rate marketing should make you reach for your wallet and leave.
How to actually trade a 75% failure rate
Accept the base rate — then filter, knowing what filters do. Confirmation rules — candle closes beyond the level, higher-timeframe agreement, session awareness — genuinely improve the odds. What they don't do is make breakouts "safe." Our signals carry those filters and fail three times in four. Filters buy you percentage points; they don't repeal the base rate.
Size every trade for the −1R outcome. Two of three breaks come back through the entry. If a full stop-out costs more than you can shrug at, the failure rate will eventually find you. This is why we quote every result in R — risk first, reward as a multiple of it.
Let winners reach their targets. The math above is unambiguous: at these win rates, +1R profit-taking converts a winning system into a losing one. The 24.5% that follow through must be allowed to pay +3R.
Put the failure where it pays. Same strategy, different clock: H1 beat M15, Asia and London beat the US afternoon, yen crosses beat silver by a mile. You don't need a better breakout — you need your breakouts fired where the winners run.
That last part is the job our engine does all day: it watches the levels, applies the confirmation filters, tags every alert with its session and timeframe context, and then publishes the results — the 24.5% and the 75.5% alike. If you'd rather inherit that discipline than rebuild it, start free.
Methodology: how this study was run
Numbers about trading are cheap; checkable numbers aren't. This section spells out exactly what was measured, how, and where the traps aren't — so a skeptical reader can audit the claim instead of taking our word for it.
This is live signal data, not a backtest. Every row in the sample was written to our production database at the moment the signal fired, with its entry, stop, and target already fixed — and the rows that cleared our delivery filters went out to subscribers by email and push in real time from those same records. Outcomes were graded afterward, as price reached the target, the stop, or the 72-hour deadline. Every row's creation timestamp precedes its exit timestamp, so look-ahead bias isn't reduced here — it's structurally impossible. Nothing was replayed, re-simulated, or re-scored after the fact.
What counts as a breakout signal. The sample is two entry-on-the-break strategies, exactly as they ran in production:
- Pivot breakout (continuation): a 15-minute candle closes through a floor-trader pivot level — the standard formula computed from the prior period's high, low, and close, across weekly, monthly, and yearly families — in the direction of the higher-timeframe trend. The entry candle itself has to pass quality gates: the close can't land more than a fixed distance beyond the level (no chasing extended candles), the close must sit in the leading 60% of the candle's range, and the wick against the trade is capped both in pips and relative to the candle body. Breaks at the outermost pivot bands are excluded as exhausted.
- Asian range breakout: a break of the 00:00–07:00 UTC session range, taken only during the 07:00–11:00 UTC London window, on five liquid pairs.
Entry, stop, and target accounting. Entry is the breakout candle's closing price — the same price stamped on the subscriber alert. The stop sits on the far side of the broken level, plus an instrument-calibrated buffer: invalidation means price traded back through the level that broke. The target is the next pivot level in the break's direction, front-run by a small buffer so a near-miss at the obvious magnet still pays. Results are measured in R — profit divided by the distance from entry to stop — using recorded prices: (exit − entry) / (entry − stop), sign-adjusted for shorts. A signal resolves exactly one of three ways: target, stop, or expiry at the 72-hour evaluation deadline. Expiries count as failures in every headline number, including the 79 that expired in profit.
Prices. Fifteen-minute OHLC mid quotes from our market-data feed (OANDA). R is computed on recorded signal and exit prices without modeling spread or slippage; on the majors that costs a few hundredths of an R per trade, which does not move any conclusion in this piece, but a live account would net slightly less than the raw figures.
The sample, with no survivorship pruning. All 1,611 breakout-family signals that completed between February 24 and August 7, 2026 — every signal the detector fired, including the ones our own delivery filters held back from customers as lower quality. This measures raw setup behavior, not a curated highlight feed, and no signal was removed for any reason. Fifteen instruments: nine FX majors and crosses, gold, silver, WTI crude, and three US index CFDs.
One thing this isn't: a frozen ruleset. Our detection thresholds evolved during the window the way live desks actually operate — a quality-score floor was added in July, and session scoping followed. Every row carries a strategy-version stamp, so cohorts remain separable, but the headline numbers describe the stream as it actually fired across those six months, not one immutable configuration replayed over history.
The aggregates in this article are generated by a single read-only script against the signal database. Researchers and editors who want the queries, the schema, or version-split cuts can ask: support@breakoutalerts.io.
The honest caveats
This is one firm's tracked data, not a universal constant. The sample is 1,611 completed breakout-family signals (breakout continuation + Asian range breakout) on FX majors and crosses, gold, silver, oil, and US index CFDs, February 24 – August 7, 2026. Every signal had momentum/level filters applied before firing, exits are fixed target/stop with a 72-hour evaluation deadline, and the window covers one broad market regime. A different strategy, exit model, or tape produces a different number — which is why we'll rerun this report and update the figures as the dataset grows. When the number moves, this page moves with it.
Past performance is not indicative of future results. Signals are educational market alerts, not investment advice. Trading involves risk.
Frequently asked questions
What percentage of breakouts fail? In our tracked data — 1,611 completed breakout signals, February 24 to August 7, 2026 — 75.5% failed to reach their target, and 66.7% reversed fully to the stop. Only 24.5% followed through. These were filtered signals; unfiltered level breaks fail more often.
Why do most breakouts fail? Obvious levels are where stops cluster. Price gets pushed through a high, low, or pivot to collect that liquidity, then snaps back — the classic false breakout. Thin sessions, news spikes, and counter-trend breaks make it worse.
Does a high failure rate mean breakout trading doesn't work? No — the same sample netted +337R. Losers averaged −0.97R, winners +3.04R, so the system breaks even near a 24% win rate and ran at 29.4%. Expectancy pays, not accuracy.
Which session has the most false breakouts? New York: 80.2% of its breakout signals failed and it averaged −0.11R. But don't rank sessions by failure rate alone — Asia and the London morning failed ~78% and were the most profitable windows in the data.
Do breakouts fail more on lower timeframes? Barely — M15 failed 74.9%, H1 77.5%, H4 69.9%. The real difference is payout: H1 averaged +0.63R per signal while M15 sat at breakeven.
The takeaway
Three out of four breakouts fail — measured, not folklore, and steady across every month we've tracked. The edge was never in dodging the failures. It's in paying −1R tolls quickly, in the right sessions, on the right charts, so the one break in four that runs pays +3R and the ledger still reads +337R.
The market pays expectancy, not accuracy. We got the receipts — every Saturday, in The Dossier.
We got receipts.
Every signal our desk fires, graded in R — winners and losers, no cherry-picking. One email, every Friday.
Share this post
Know a trader who could use this one? Send it their way.