Data
What our tracked signals actually did. Every study below is built on timestamped trades with the losers left in.

Calibration Log: Every Rule Change We've Made, Dated
How our desk grades and delivers signals changes when the numbers make us. Every change since July 2026, what forced it, and what it means for your alerts.

Retest in Trading: What 1,446 Breakouts Say About Waiting
Failed breakouts died in 2 hours (median); winners took 11 to pay. What a retest is, why it works, and break-and-retest rules — from 1,446 tracked signals.

Win Rate vs Risk/Reward: 2,292 Tracked Trades
Our win rates run 19% to 49% — and all of them make money. Across 2,292 tracked trades, just 7% produced every dollar of profit. The full math.

What Percentage of Breakouts Fail? Data From 1,611 Signals
75.5% of 1,611 tracked breakouts failed — two-thirds fully reversed. The rates by session, timeframe and pair, and why the sample still paid +337R.
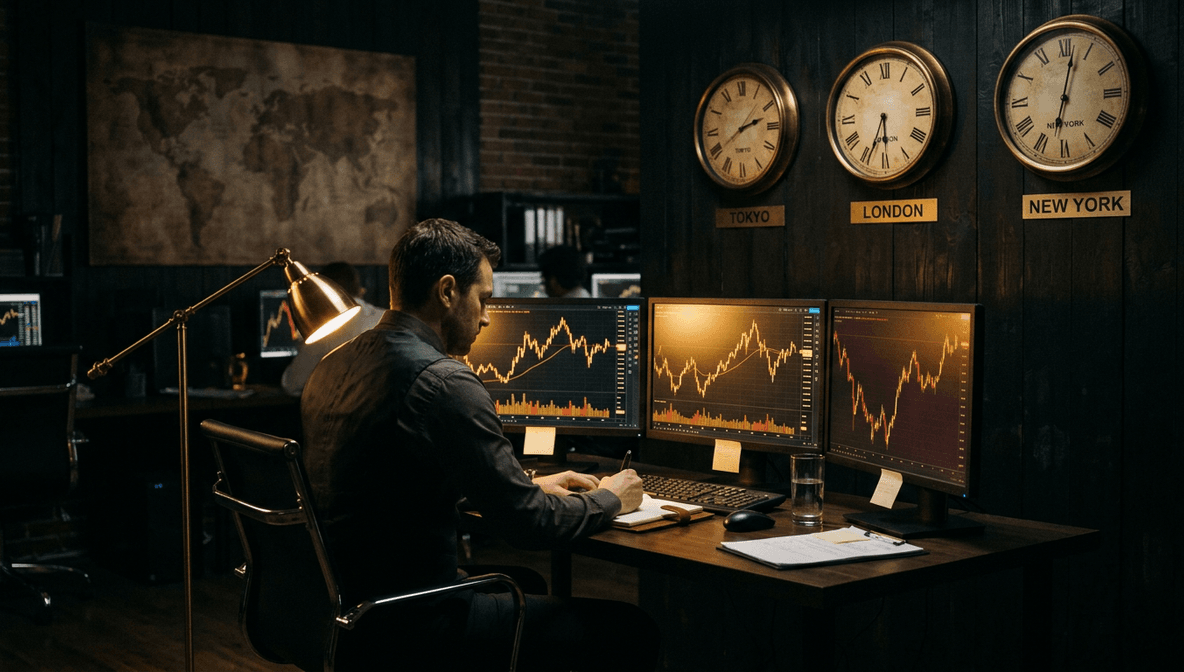
Best Time to Trade Forex: 2,173 Signals of Data
Not a timezone chart — 2,173 tracked signals: session win rates, average payoff per trade, and the session that quietly loses money.

False Breakouts: Why 3 in 4 Level Breaks Fail
Why false breakouts happen, how to spot a fakeout before it takes your stop, and the confirmation rules that beat stop hunts — from 1,611 tracked signals.

Best Timeframe for Breakout Trading? What the Data Says (M15–D1)
M15, H1, H4 or daily? In 1,569 tracked breakout signals, H1 paid +0.63R per trade while M15 sat at breakeven. The real trade-offs — and the verdict.

Mean Reversion Strategy (48-Hour Edge)
Why this pivot-based mean reversion model works so well and why we evaluate outcomes within 48 hours (avg ~78% win rate).

Pivot Point Trading: The Clean Framework
A practical pivot framework and how Breakout Alerts uses pivots to structure entries and exits.