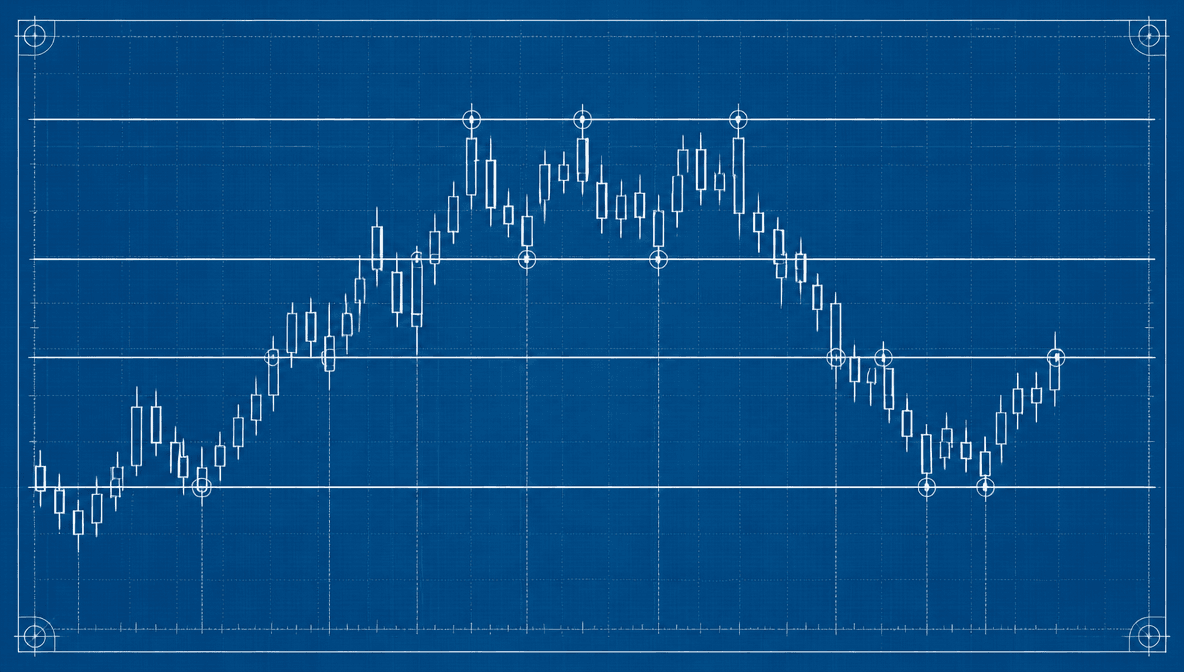
Forex Pivot Points: How Often R1, R2 and R3 Actually Get Hit (1,728 Weeks Measured)
1,728 weeks of pivots on 9 FX pairs, counted. R1 hit in 48% of weeks, R2 17%, R3 5%. When R1 is touched, the week closes beyond it 49% of the time.
Every forex trader I know has pivot points on the chart. I've never met one who's measured them. The standard guide tells you R1 is resistance, R2 is stronger resistance, the pivot is your bias line, and then shows you a drawing of a candle bouncing off a line. Nobody says how often any of that actually happens.
So we counted. Nine major pairs, every week from January 2023 to September 2026, the same classic weekly floor pivots our live pivot pages compute every Sunday. That's 1,728 pair-weeks. For each one we asked a simple question: which levels did price actually reach?
Here's what we found.
How often each level gets hit
| Level | Weeks it was reached |
|---|---|
| Central pivot (PP) | 76% |
| R1 | 48% |
| S1 | 42% |
| R2 | 17% |
| S2 | 16% |
| R3 | 5% |
| S3 | 6% |
Three things jump out.
The pivot really is a magnet. Three weeks out of four, price comes back through the central pivot at some point. If you're waiting for a pullback to PP, you'll usually get it.
R1 and S1 are the levels that matter. About half of all weeks reach R1, a little fewer reach S1, and the gap between those two is just the upward drift these pairs had over the period. R2 and S2 get reached one week in six. R3 and S3 are rare enough that a touch is an event.
One week in five goes nowhere. In 21% of weeks price never reached R1 or S1. Only 11% of weeks reached both. Most weeks pick a side and stay there.
R1 is where the market makes up its mind, not a wall
The most repeated line about pivots is "R1 is resistance." Here's what happened when price actually got there:
| When price reached… | …the week closed beyond it | …and also reached the next level |
|---|---|---|
| R1 | 49% | R2: 35% |
| S1 | 47% | S2: 39% |
| R2 | R3: 30% | |
| S2 | S3: 39% |
A coin flip. When R1 gets touched, the week ends above it half the time and back below it half the time. That's not a wall. It's the spot where the market shows its hand, and honestly that's more useful to know. The reaction at R1 tells you something. The level on its own tells you nothing.
And look how fast the odds fall off. Once price has reached R1, it goes on to R2 about one time in three. Once it's at R2, it reaches R3 less than one time in three. Every extra rung costs you. That's why our own desk takes a fixed 2R on level trades instead of holding out for the next line.
The pivot as a bias line
The other thing everyone says is that trading above the pivot is bullish. It is, a bit.
| Week opened… | …and closed on the same side of PP |
|---|---|
| Above the pivot | 68% |
| Below the pivot | 60% |
Two weeks in three, whichever side of the pivot you open on is the side you close on. That's a real edge and a small one, and again the difference between the two rows is the period's upward drift, not something magic about the pivot. Use it to lean, not to bet the house.
When in the week the levels get hit
We had 1,367 weeks where R1 or S1 got reached. Here's the day the first touch happened, and what your odds looked like if it hadn't happened yet:
| Day | Share of first touches | Still untouched at this day's close? Chance it gets hit later in the week |
|---|---|---|
| Monday | 28% | 73% |
| Tuesday | 29% | 62% |
| Wednesday | 21% | 47% |
| Thursday | 14% | 24% |
| Friday | 9% | — |
More than half of all first touches happen by Tuesday's close. If a level hasn't been reached by Wednesday, it's less than even money to be reached at all. By Thursday's close it's one in four. So if you're planning your week around a level, the plan mostly plays out in the first three days.
Pair by pair
| Pair | R1 | S1 | R2 | S2 | Neither R1 nor S1 |
|---|---|---|---|---|---|
| EUR/USD | 45% | 44% | 18% | 16% | 21% |
| GBP/USD | 48% | 41% | 18% | 14% | 22% |
| USD/JPY | 52% | 39% | 20% | 17% | 19% |
| USD/CHF | 44% | 46% | 13% | 19% | 22% |
| USD/CAD | 45% | 44% | 17% | 18% | 20% |
| AUD/USD | 51% | 42% | 16% | 17% | 23% |
| NZD/USD | 46% | 44% | 16% | 17% | 21% |
| EUR/JPY | 52% | 39% | 16% | 14% | 18% |
| GBP/JPY | 53% | 37% | 20% | 13% | 22% |
That's 192 weeks per pair. The yen crosses hit R1 the most, which is three years of yen weakness showing up in the numbers. USD/CHF is the one pair where S1 got reached more than R1. The thing I find most interesting is the last column: between 18% and 23% on every single pair. About one week in five is a dead week, no matter what you trade.
What this changes about how you trade them
- PP is the magnet. R1 and S1 are where decisions get made. The data backs both of the oldest pivot rules. It does not back "R1 is resistance."
- Trade the reaction, not the level. A touch of R1 tells you nothing about direction. A rejection close, or a clean break through it, tells you plenty.
- Take the first target. Continuation from R1 to R2 is one in three. If you're holding for R2 by default, you're giving the trade back two times out of three.
- Lean with the pivot, don't lean on it. Open above PP, close above PP: two weeks in three. Enough to favour longs. Not enough to skip your setup.
- Plan for Monday through Wednesday. Most first touches come early. A level nobody's touched by Thursday is usually staying that way.
- Respect R2 and S2. Don't chase R3. One week in six reaches R2. One in twenty reaches R3. Fading R2 against a trend is how you get run over, and targeting R3 is how you end up with nothing.
What a pivot point is
The central pivot (PP) is just the average of last period's high, low and close:
PP = (High + Low + Close) / 3
The support and resistance levels step out from there using the period's range:
R1 = (2 × PP) − LowS1 = (2 × PP) − HighR2 = PP + (High − Low)S2 = PP − (High − Low)- R3 / S3 go one range further still.
The arithmetic isn't the point. The point is that these levels come from real data and they're fixed for the whole period. You mark them once and trade against them all week, instead of redrawing lines to fit whatever you already want to believe. Everyone with the same data gets the same lines, and that's exactly why price tends to react at them.
You don't have to calculate any of this. We publish the full ladder for every major pair on our live forex pivot points pages, updated every Sunday.
Weekly, monthly, or yearly pivots?
- Weekly pivots are home base for most intraday and swing traders. They update once a week, they hold still through the sessions, and on H1 and H4 charts they're hard to beat. That's why this study used them.
- Monthly pivots give you the bigger picture: where a larger move might run out of steam.
- Yearly pivots mark the big turning points that matter if you hold positions for months.
Every one of our pivot pages shows all three side by side, so you can line up the intraday level with what's above it.
The two setups
Pivot breakout. Price breaks and closes through a level with some force, then keeps going toward the next one. You enter on the break, target the next level, and put your stop back below the one you broke. The data says continuation to the next level is one in three, so this trade needs a strong session behind it.
Pivot reversal. Price runs into a level, rejects it, and rotates back toward the pivot. You fade the level, target PP, and put your stop beyond the level you faded. The data says PP gets reached three weeks in four, which is why the reversal's target is the more reliable of the two.
Session matters for both. London and New York give you the cleanest reactions at pivots. Off-hours breaks in thin liquidity fail more often, which is something we already knew from our breakout data, and it carries straight over.
Common mistakes
- Trading every touch. Half of R1 touches close right back below it. Wait for the reaction.
- Ignoring the trend. Fading R2 in a strong uptrend is how you get run over.
- Stops right at the level. Everyone's stop sits at the round pivot. Put yours beyond the next level so a normal overshoot doesn't take you out.
- Holding for R3. One week in twenty. Take the first target and treat anything past it as a bonus.
How our desk trades pivots
We don't fire an alert just because price touched a line. The setup we run live is the Pivot Extreme Fade: the first touch of a rare weekly, monthly or yearly extreme (R2, R3, S2 or S3), a close back inside the level, entry at that close, a stop beyond the rejection wick, and a fixed 2R target. The level gets one attempt and then it's spent, whether we traded it or not. Every one of those rules came from the numbers you just read. The extremes are rare, the reaction carries the information, and the next rung is too far away to count on.
It's been on the public ledger since July 29, 2026. As of this update that's 37 delivered signals, a 43% win rate and +6.7R, or about +0.18R per signal. That's a small sample and we're not going to pretend otherwise. You can watch it grow, losers included, in the weekly Dossier and the calibration log. R measures how the alert tracked against its initial risk, not trading returns, and past performance is not indicative of future results.
See this week's levels
We publish updated forex pivot points for every major pair: the full R1–R5 / S1–S5 ladder plus the central pivot, refreshed weekly, monthly and yearly, with the current bias and a 30-day record of our alerts on that pair. Jump straight to a pair:
How we measured this
- Pairs: EUR/USD, GBP/USD, USD/JPY, USD/CHF, USD/CAD, AUD/USD, NZD/USD, EUR/JPY and GBP/JPY. The nine we publish pivots for.
- Window: January 2, 2023 to September 12, 2026. 192 complete weeks per pair, 1,728 pair-weeks in all.
- Data: daily mid-price candles from our market data provider, grouped into Monday-to-Friday trading weeks. Holiday weeks with fewer than four sessions were dropped.
- Levels: classic floor pivots from the prior week's high, low and close, using the formulas above. It's the same math our pivot pages fall back on when a hand-transcribed level isn't available, so the study and the site agree.
- No peeking. Each week's levels come only from the week before it.
- "Reached" means the week's high touched or went past the level, or the low touched or went below it. It doesn't require a close beyond the level. We report that separately.
- Caveats. These are mid prices, so real fills sit a spread away from every level. Most of these pairs drifted higher over the period, which is why the R-side numbers run above the S-side numbers. That's the period talking, not the tool. Weekly pivots only; daily and monthly ladders will behave differently.
- Check our work. The script is in our API repository as
src/scripts/pivotTouchStudy.ts. Point it at any date range and you'll get the same tables.
Frequently asked questions
How often do weekly pivot levels get hit? Across 1,728 pair-weeks on nine FX pairs, price touched the central pivot in 76% of weeks, R1 in 48%, S1 in 42%, R2 in 17%, S2 in 16%, R3 in 5% and S3 in 6%. One week in five never reached R1 or S1.
How are pivot points calculated? PP = (High + Low + Close) / 3. Then R1 = (2 × PP) − Low, S1 = (2 × PP) − High, and R2/S2 and R3/S3 step out by the period's range. We publish the levels for every major pair.
Is R1 support or resistance, or a target? A coin flip. When price reached R1 the week closed above it 49% of the time and back below it 51%. S1 did the same. They're where the market makes up its mind, not walls.
What is the best pivot timeframe for day trading? Weekly pivots on H1 or H4 charts for most people, because the levels stay put all week. Daily pivots suit scalping. Monthly and yearly give you context.
Are pivot points a good indicator? They show you where price reacts, not which way it goes. Opening above the pivot led to a close above it 68% of the time, a real but small edge, and R1 held or broke at even odds.
When in the week do pivot levels usually get hit? Early. 28% of first touches came on Monday and 29% on Tuesday. A level still untouched at Thursday's close got hit on Friday only 24% of the time.
We got receipts.
Every signal our desk fires, graded in R — winners and losers, no cherry-picking. One email, every Friday.
Share this post
Know a trader who could use this one? Send it their way.